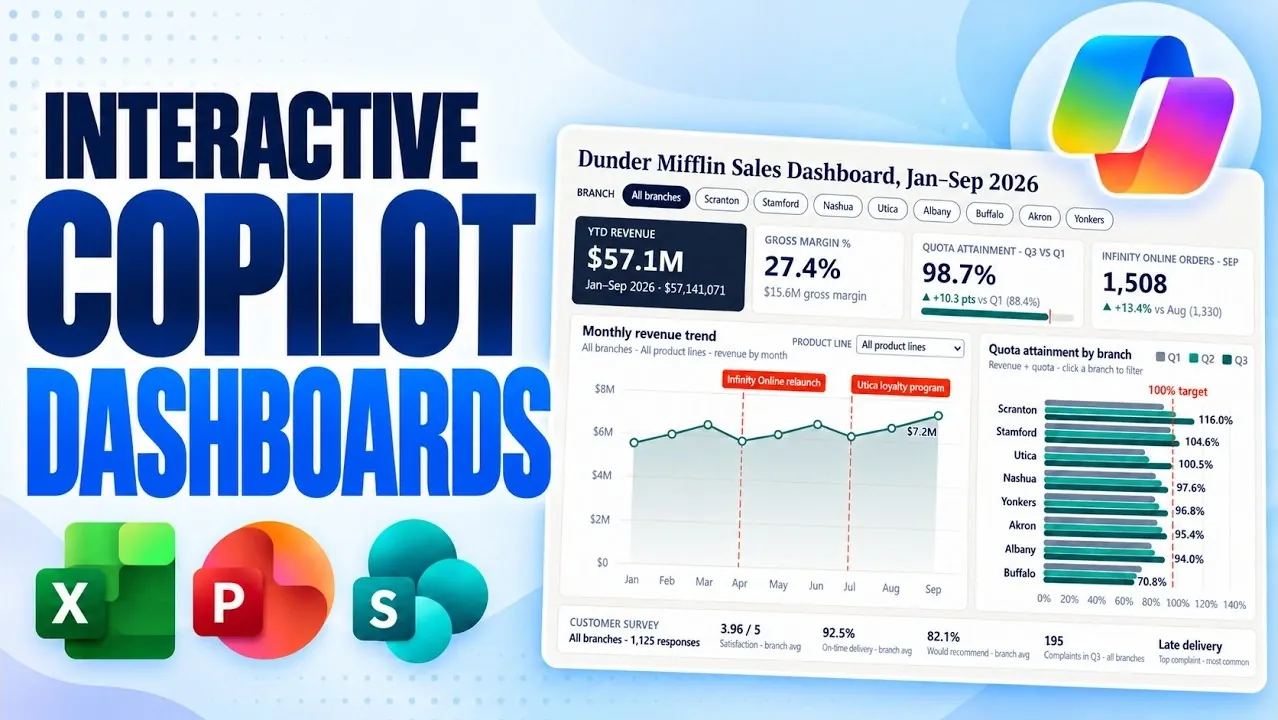
Microsoft Copilot is changing how users approach dashboard creation in Excel, PowerPoint and SharePoint by integrating natural language prompts for effortless design and functionality. As demonstrated by Mike Tholfsen, this approach allows users to generate dashboards that are both interactive and visually engaging without requiring coding expertise. For example, in Excel, you can create a sales performance dashboard that updates automatically with real-time data, eliminating the need for manual adjustments. This functionality not only simplifies setup but also ensures your dashboards remain accurate and relevant as your data evolves.
Dive into this breakdown to explore how Copilot enhances your workflow across these platforms. You’ll learn how to create dynamic visualizations in Excel, integrate interactive dashboards into PowerPoint presentations and use SharePoint for team collaboration with centralized, real-time data sharing. Whether you’re managing KPIs, presenting trends, or fostering organizational alignment, these insights will help you maximize the potential of Copilot’s dashboard features for more efficient and impactful data analysis.
Excel Dashboards: Unlocking Real-Time Data Insights
TL;DR Key Takeaways :
- Microsoft Copilot enables the creation of dynamic, real-time dashboards across Excel, PowerPoint and SharePoint using natural language prompts, eliminating the need for coding or advanced technical skills.
- Excel dashboards feature real-time updates, customizable filters and dynamic visualizations, streamlining data analysis and automating repetitive tasks.
- PowerPoint dashboards allow for interactive presentations with customizable themes, dynamic updates and drill-down capabilities to enhance audience engagement.
- SharePoint and OneDrive dashboards provide centralized, collaborative data visualization with seamless cloud integration, offline accessibility and natural language-driven customization.
- Copilot simplifies complex data analysis, offering flexibility, customization and seamless integration across Microsoft tools, empowering users to make data-driven decisions efficiently.
Excel, a cornerstone of data analysis, becomes significantly more powerful with the integration of Copilot. Using natural language commands, you can create interactive dashboards tailored to your specific needs, featuring dynamic charts, KPI cards and what-if scenarios. For example, if you’re monitoring sales trends, Copilot can generate a dashboard that updates automatically as new data is entered into your workbook, eliminating the need for manual adjustments. Key features of Excel dashboards include:
- Real-time updates that reflect the latest changes in your data, making sure accuracy and relevance.
- Customizable filters, such as time periods or customer segments, for targeted and granular analysis.
- Dynamic visualizations, including customer value maps, revenue distribution charts and trend analyses.
These capabilities allow you to focus on interpreting data and identifying actionable insights rather than spending time on repetitive tasks. By automating updates and simplifying complex data visualization, Copilot enhances both efficiency and accuracy in your analysis.
PowerPoint Dashboards: Transforming Presentations with Interactive Data
Copilot extends its functionality to PowerPoint, allowing you to create interactive dashboards directly within your slides. This feature is particularly valuable for presentations where showcasing data trends or performance metrics dynamically can enhance audience engagement. For instance, you can integrate filters for specific branches, KPI tiles, or customer survey results, allowing your audience to explore details interactively during your presentation. Highlights of PowerPoint dashboards include:
- Customizable themes and styles, ranging from corporate branding to creative designs, making sure visual consistency.
- Dynamic updates that keep your data current, even as new information becomes available.
- Interactive elements, such as drill-down capabilities, allowing deeper exploration of data during live presentations.
By combining compelling storytelling with robust data visualization, PowerPoint dashboards help you communicate insights effectively while keeping your audience engaged and informed.

Discover other guides from our vast content that could be of interest on Microsoft Copilot.
- Microsoft Copilot Adds OpenAI GPT 6.1 and Anthropic Claude Opus 5.5
- Automate Project Plans with 6 Microsoft 365 Copilot Upgrades
- 8 New Features in Microsoft 365 Copilot: Real-Time Editing Arrives
- 6 Powerful Microsoft Copilot in Excel Use Cases & Workflow Examples
- Microsoft Copilot Can Now Build Microsoft PowerPoint Slides from OneNote
- New Microsoft Copilot Super App with Autopilot Assistant to Handle Your Work
- 12 New Copilot Features & Microsoft Edge AI Browser Guide
- Save Hours of Work with These 10 Microsoft Copilot Prompts
- Microsoft Copilot 2026 Adds OpenAI GPT 5.6 and Anthropic Claude 5
- 7 New Microsoft Copilot Features: Integrate Task Management Across Work Apps
SharePoint and OneDrive Dashboards: Enhancing Team Collaboration
For teams operating in collaborative environments, SharePoint and OneDrive dashboards offer a centralized solution for data visualization and sharing. With Copilot, you can build dashboards directly from spreadsheets or lists stored in the cloud, making sure that your data is always up-to-date and accessible. These dashboards can include charts, insights and filters, making it easier to analyze and share information across your organization.
Advantages of SharePoint and OneDrive dashboards include:
- Seamless integration with cloud storage, allowing real-time updates and collaboration.
- Offline accessibility, allowing you to download dashboards for use without an internet connection.
- Natural language prompts that simplify the process of creating and updating dashboards.
Whether you’re managing project timelines, tracking team performance, or analyzing organizational metrics, these dashboards ensure that everyone stays informed and aligned, fostering better collaboration and decision-making.
Customization and Flexibility: Dashboards Built for Your Needs
One of Copilot’s standout features is its ability to customize dashboards to meet your unique requirements. You can add interactive elements like sliders, filters and drill-down options to explore data from multiple perspectives. For example, a sales performance dashboard might include filters for regions, product categories, or time periods, allowing you to identify trends and opportunities with precision.
Additionally, Copilot allows you to style your dashboards to align with specific themes or branding guidelines. Whether you prefer a minimalist design or a vibrant, creative aesthetic, Copilot makes it easy to ensure your dashboards reflect your organizational or presentation needs. This flexibility ensures that your dashboards are not only functional but also visually aligned with your goals.
Streamlined Usability: Simplifying Complex Data Analysis
Copilot’s intuitive interface ensures that creating dashboards is straightforward and accessible, even for users without technical expertise. All you need is a Copilot subscription and the ability to describe your requirements using natural language prompts. For instance, you can ask Copilot to “create a sales performance dashboard with monthly revenue trends and customer churn analysis,” and it will generate a dashboard tailored to your request.
Key benefits of Copilot include:
- Eliminating the need for coding or advanced technical skills, making dashboard creation accessible to all users.
- Streamlining complex data analysis and visualization tasks, saving time and effort.
- Making sure seamless integration across Microsoft tools like Excel, PowerPoint and SharePoint for a unified experience.
By simplifying the process of creating and managing dashboards, Copilot enables you to focus on deriving insights and making informed, data-driven decisions. This ease of use ensures that even complex data analysis becomes manageable and actionable for a wide range of users.
Empowering Data-Driven Decisions with Microsoft Copilot
Microsoft Copilot is transforming the way you create and use dashboards, offering a powerful yet user-friendly solution for data analysis, visualization and presentation. Whether you’re working in Excel, PowerPoint, or SharePoint, Copilot enables you to build interactive, real-time dashboards that are both functional and visually appealing. With features like natural language prompts, customizable filters and seamless integration across Microsoft tools, Copilot ensures you can analyze, present and share data with ease.
By using these capabilities, you can enhance your decision-making processes, improve collaboration across teams and deliver impactful insights that drive organizational success. Copilot’s ability to simplify complex tasks while maintaining flexibility and customization makes it an indispensable tool for modern data analysis and visualization.
Media Credit: Mike Tholfsen
Disclosure: Some of our articles include affiliate links. If you buy something through one of these links, Geeky Gadgets may earn an affiliate commission. Learn about our Disclosure Policy.
