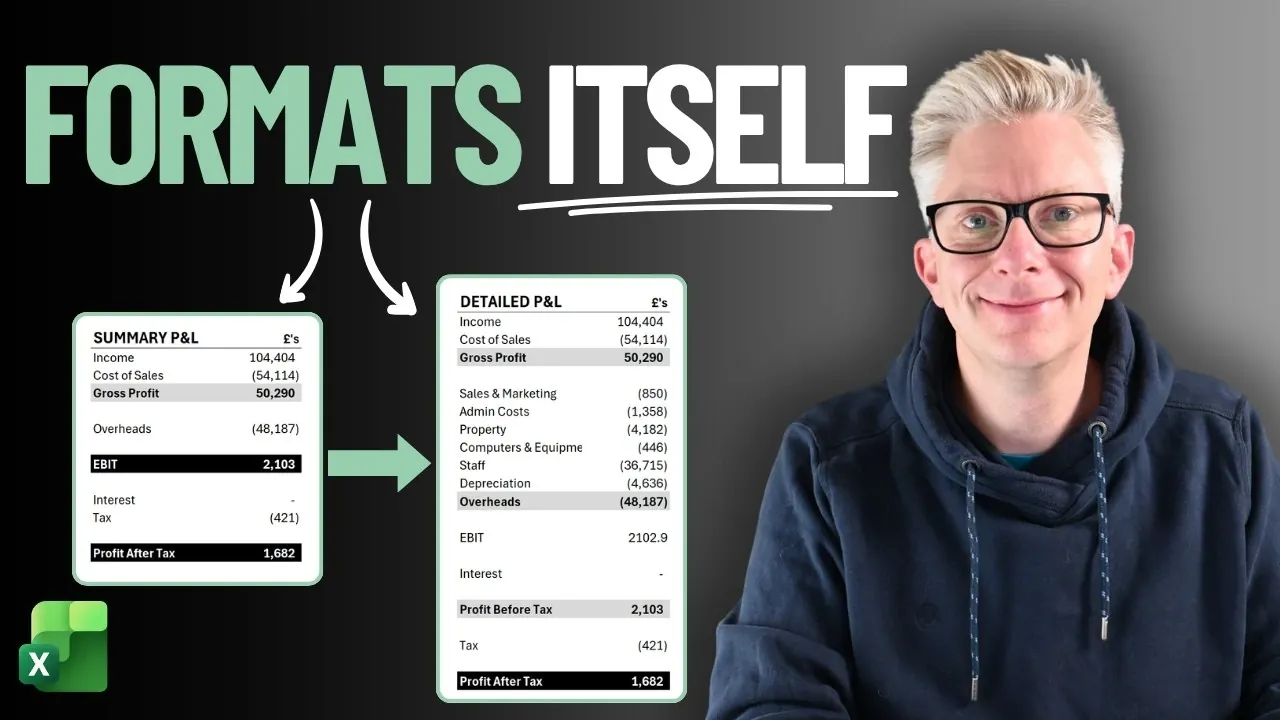
Conditional formatting in Excel is often associated with basic color coding or highlighting, but there’s a more advanced approach that can significantly enhance financial reports. Excel Off The Grid explores how to use conditional formatting with formulas to dynamically adjust formatting based on the hierarchical structure of a overview, such as a Profit and Loss (P&L) statement. For example, you can use a formula like `=ISNUMBER(SEARCH(“Total”, A1))` to identify and format rows containing the word “Total,” making sure that key figures like totals and subtotals stand out. This technique not only improves readability but also adapts automatically when switching between detailed and summary views, reducing manual effort.
Dive into this guide to learn how to apply this method effectively in your own financial reports. You’ll discover how to set up conditional formatting rules using logical formulas, define distinct styles for totals, subtotals and line items and account for dynamic arrays that expand or contract with your data. By the end, you’ll have a clear framework for creating polished, adaptable reports that maintain consistency and clarity across different layouts.
Why Dynamic Formatting is Essential
TL;DR Key Takeaways :
- Conditional formatting with formulas in Excel enhances the clarity and readability of dynamic financial reports, such as Profit and Loss (P&L) statements, by automating formatting updates based on hierarchical structures.
- Dynamic formatting visually distinguishes between totals, subtotals and line items, adapting seamlessly between detailed and summary views to save time and reduce manual effort.
- Formulas like
=ISNUMBER(SEARCH("Total", A1))can identify specific rows for formatting, making sure consistent application of styles across the overview. - Dynamic arrays and functions like
FILTERorUNIQUErequire conditional formatting rules to account for expanding or contracting data ranges, maintaining visual consistency. - By automating formatting rules and incorporating data validation lists, financial reports become more functional, visually appealing and easier to interpret, streamlining reporting workflows.
Dynamic formatting plays a pivotal role in visually distinguishing between different levels of data within a P&L overview, such as totals, subtotals and individual line items. This distinction is particularly valuable when switching between detailed and summary layouts. For example:
- Detailed View: Subtotals can be highlighted with bold text and a light gray background for better visibility.
- Totals: These can stand out with bold white text on a black background, emphasizing their importance.
- Line Items: These can remain unformatted to maintain simplicity and focus on the data.
By automating these formatting rules, you eliminate the need for repetitive manual adjustments. This not only saves time but also minimizes the risk of errors, making sure your reports remain consistent and easy to interpret regardless of the level of detail displayed.
How Conditional Formatting with Formulas Works
The core of this technique lies in using formulas within conditional formatting to evaluate specific conditions. These formulas return `TRUE` or `FALSE`, determining whether a particular formatting rule should be applied. For instance:
- A formula like `=ISNUMBER(SEARCH(“Total”, A1))` can identify rows containing the word “Total” in column A, allowing you to apply distinct formatting to those rows.
- Text functions such as `SEARCH` or logical operators can detect patterns or keywords that signify totals or subtotals, allowing precise targeting of formatting rules.
By carefully locking cell references where necessary, you ensure that these rules are applied consistently across your desired range. This precision allows you to create a clean, professional look that adapts seamlessly to changes in your overview structure.

Here is a selection of other guides from our extensive library of content you may find of interest on Excel.
- 19 Clickable Excel Tools Replace Tedious Worksheet Scrolling
- Convert Excel Spreadsheets Into No-Code Mobile Apps
- Master Advanced Excel Functions BYROW vs MAP vs SCAN vs REDUCE
- Why Excel’s FILTER Function Outperforms VLOOKUP for Complex Data
- Google Pixel 10 Pro XL Price Leaks: How Much Will it Cost?
- Excel iPad Quick Start Guide 2026: Setup, Tips, Widgets & Shortcuts
- 15 Modern Excel Functions Worth Knowing in 2026 That Outclass Clunky Workflows
- Master Dynamic Excel Formulas with Dot Operator in 2025
- Build Finance Models in Minutes with Claude for Excel
- How to Unlock Excel Sheets Without a Password
Step-by-Step Guide to Implementation
To effectively apply this conditional formatting technique, follow these steps:
- Identify Rows for Formatting: Use formulas to detect rows that require specific styles. For example, text functions like `SEARCH` or logical operators can help identify totals and subtotals.
- Set Up Conditional Formatting Rules: Apply these rules using standard cell references rather than table references to ensure compatibility across various layouts.
- Define Formatting Styles: Assign distinct styles for each hierarchy level to enhance readability. For instance:
- Totals: Bold text, white font, black fill for maximum emphasis.
- Subtotals: Bold text, black font, light gray fill for clear differentiation.
- Line Items: Standard text with no additional formatting to maintain simplicity.
This structured approach ensures that your formatting rules are dynamic, easy to maintain and adaptable to evolving overview structures, making your financial reports both functional and visually appealing.
Adapting to Dynamic Arrays
Dynamic arrays introduce additional complexity, as their size can change based on the data they process. To ensure your conditional formatting rules remain effective, apply them to a range larger than the current array. This ensures that new data added to the array is automatically formatted.
For example, when using functions like `FILTER` or `UNIQUE` to create dynamic layouts for your P&L overview, the formatting rules should account for potential expansions or contractions in the data range. By planning for these scenarios, you can build a robust formatting system that adjusts seamlessly to changes, making sure your overview remains visually consistent and accurate.
Practical Example of Dynamic Formatting
Consider a P&L overview that offers both detailed and summary views. A data validation list allows you to toggle between these layouts effortlessly. The overview uses formulas to map data to the appropriate hierarchy level, making sure that totals and subtotals are correctly identified and formatted.
For instance:
- In the detailed view, subtotals might be calculated using a `SUMIFS` formula, while totals are derived from a broader range of data.
- Conditional formatting rules apply distinct styles to these calculations, making the overview easy to read and interpret.
- When switching to the summary view, the same rules automatically adapt to the condensed layout, maintaining a professional and polished appearance.
This example demonstrates how conditional formatting can streamline the process of creating dynamic, visually appealing financial reports. By automating the application of formatting rules, you can focus on analyzing the data rather than managing its presentation.
Maximizing the Benefits of Conditional Formatting
Using conditional formatting with formulas is a powerful yet underutilized technique for managing dynamic financial reports. By automating the process of highlighting key sections, you ensure clarity and consistency across different layouts. Incorporating dynamic arrays and data validation lists further enhances the flexibility of this approach, making it an indispensable tool for optimizing financial reporting workflows. With careful planning and implementation, this method can transform the way you present and manage financial data, making sure your reports are both functional and visually compelling.
Media Credit: Excel Off The Grid
Disclosure: Some of our articles include affiliate links. If you buy something through one of these links, Geeky Gadgets may earn an affiliate commission. Learn about our Disclosure Policy.
