Have you ever found yourself staring at a growing dataset in Excel, wondering how to make sense of the numbers without spending hours manually updating formulas? Whether you’re tracking monthly sales, monitoring performance metrics, or analyzing trends over time, cumulative averages can be a fantastic option. They offer a simple yet powerful way to smooth out short-term fluctuations and uncover meaningful patterns. But let’s be honest—figuring out how to calculate them efficiently, especially as your data evolves, can feel like a daunting task. If you’ve ever felt stuck or frustrated by the limitations of manual methods, you’re not alone.
The good news? Excel has come a long way, and there are now smarter, more dynamic ways to calculate cumulative averages that save time and reduce errors. In this guide Chandoo walks you through everything from basic manual techniques to advanced, scalable formulas using modern Excel functions like `SCAN`, `SEQUENCE`, and `LET`. Whether you’re an Excel novice or a seasoned pro, you’ll find practical solutions tailored to your needs.
What Are Cumulative Averages?
TL;DR Key Takeaways :
- Cumulative averages are running averages calculated from the first value to a specific point, useful for analyzing trends in sequential data like sales or performance metrics.
- Manual methods using the `AVERAGE` function are simple and effective for small datasets but require manual updates, making them inefficient for larger or dynamic datasets.
- Dynamic formulas using modern Excel functions like `SCAN`, `SEQUENCE`, and `LET` automate cumulative average calculations, adapting seamlessly to data changes and improving efficiency.
- Advanced techniques with functions like `MAP` and `TAKE` enhance scalability and simplify complex formulas, making them ideal for large or intricate datasets.
- Compatibility with Excel 365 or newer versions is essential for using advanced functions, while pivot tables offer an alternative for non-formula-based cumulative calculations.
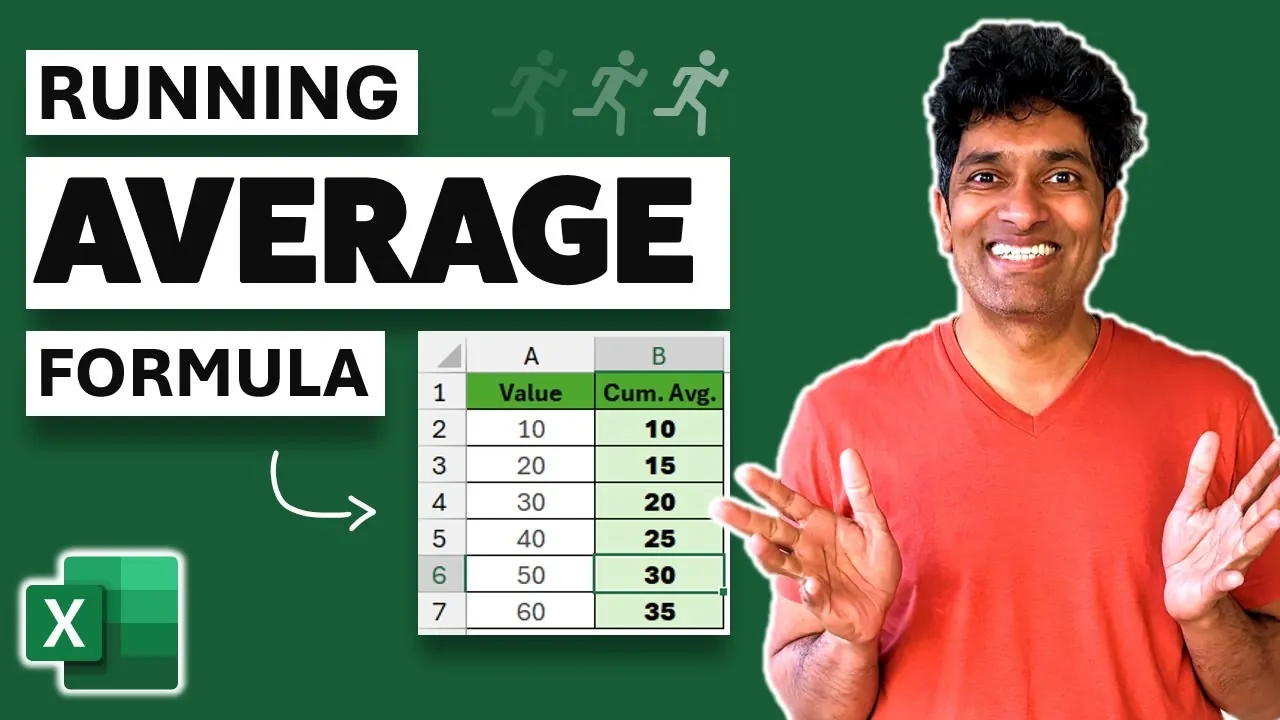
Cumulative averages represent the running average of a dataset, calculated from the first value up to a specific point. For example, if you are tracking monthly sales, the cumulative average for March would include the average of January, February, and March. This method provides a clear view of trends over time, smoothing out short-term fluctuations and offering insights into overall performance.
While the concept is straightforward, implementing cumulative averages in Excel can vary in complexity depending on the size and nature of your dataset. Excel offers both simple manual methods and advanced dynamic formulas, each with its own advantages and limitations.
Manual Methods for Cumulative Averages
The most basic way to calculate cumulative averages in Excel involves using the `AVERAGE` function with absolute references. This method is particularly effective for smaller datasets where simplicity and ease of use are priorities.
1. Assume your data is in column A.
2. In column B, enter a formula that calculates the average from the first row to the current row, such as `=AVERAGE($A$1:A1)`.
3. Drag the formula down the column to compute cumulative averages for each row.
- Advantages: This approach is easy to implement and understand, making it ideal for beginners or small datasets.
- Limitations: It requires manual updates when data changes or expands, which can be inefficient and prone to errors in larger datasets.
While manual methods are straightforward, they lack scalability and automation, making them less suitable for dynamic or frequently updated datasets.
Excel Cumulative Averages Explained

Master Microsoft Excel formulas with the help of our in-depth articles and helpful guides.
- Powerful Excel formulas you should know in 2024
- Top Excel Formulas for Speed & Performance in Large Worksheets
- 10 New Excel Functions to improve your formulas
- 10 MS Excel formulas to create next level spreadsheets
- NEW Excel Formulas to improve your spreadsheet calculations
- Writing Excel formulas using the Advanced Formula Environment
- Learn Excel conditional formatting formulas for dynamic data
- How to Use LAMBDA to Create New Formulas in Excel
- How to use MS Excel advanced formulas for data analysis
- 5 Excel formula writing tips and tricks to minimize errors
Dynamic Formulas for Automation
Modern Excel offers dynamic formulas that automate the calculation of cumulative averages, making them ideal for larger datasets or situations where data is frequently updated. Functions like `SCAN`, `SEQUENCE`, `MAP`, and `LET` allow you to create formulas that automatically adjust to changes in your data.
Using the `SCAN` Function
The `SCAN` function processes an array iteratively, applying a specified operation to each element. While it is excellent for calculating running totals, it cannot directly compute cumulative averages because averaging requires dividing running totals by running counts.
Combining Running Totals and Counts
To calculate cumulative averages dynamically, you can combine running totals and running counts:
- Running Totals: Use the `SCAN` function to calculate the cumulative sum of values.
- Running Counts: Use the `SEQUENCE` function to generate a count of rows or the `SCAN` function to incrementally count rows.
- Final Formula: Divide the running totals by the running counts to compute cumulative averages.
This method ensures that your calculations automatically adapt to changes in the dataset, providing a scalable and efficient solution for dynamic data analysis.
Advanced Techniques with `LET`, `MAP`, and `TAKE`
For more complex scenarios, advanced Excel functions like `LET`, `MAP`, and `TAKE` can simplify your formulas and enhance their scalability. These functions are particularly useful for handling large datasets or creating formulas that need to adapt seamlessly to changes.
- `LET`: This function allows you to define reusable variables within a formula, such as arrays for values, running totals, and running counts, reducing redundancy and improving readability.
- `MAP`: Applies a consistent logic to each element of an array, allowing dynamic calculations for cumulative averages across datasets.
- `TAKE`: Extracts subsets of an array to calculate averages for specific ranges dynamically, offering flexibility in analyzing portions of your data.
By using these advanced functions, you can create robust and efficient formulas that handle even the most complex datasets with ease.
Comparing Methods
Each method for calculating cumulative averages has its own strengths and weaknesses. Choosing the right approach depends on the size and complexity of your dataset, as well as your specific requirements.
- Manual Techniques: Simple and intuitive but not scalable or efficient for dynamic datasets.
- Dynamic Formulas: Automated and adaptable, making them suitable for most scenarios involving frequent data updates.
- Advanced Methods: Ideal for large or complex datasets, offering maximum scalability and automation.
Understanding these differences can help you select the most effective method for your data analysis tasks.
Key Excel Functions Explained
To effectively implement these techniques, it is essential to understand the core Excel functions involved:
- `SCAN`: Iteratively processes an array, applying a specified operation to each element.
- `SEQUENCE`: Generates a sequence of numbers, useful for counting or indexing rows.
- `MAP`: Applies a formula to each element of an array, allowing dynamic calculations.
- `TAKE`: Extracts a specified number of elements from an array for targeted analysis.
- `LET`: Simplifies complex formulas by defining reusable variables, improving clarity and efficiency.
Familiarity with these functions will enable you to create powerful and flexible formulas for cumulative averages and other data analysis tasks.
Practical Applications
The techniques discussed here extend beyond cumulative averages. They can be adapted for other cumulative operations, such as running totals, counts, or percentages. Additionally, spillable formulas ensure that your calculations update automatically when data changes, saving time and reducing the risk of errors.
These methods are particularly useful in scenarios such as financial analysis, performance tracking, and trend identification, where accurate and dynamic calculations are critical.
Compatibility and Considerations
When using advanced functions like `SCAN`, `SEQUENCE`, `MAP`, and `LET`, ensure that you are working with Excel 365 or a compatible version, as these features may not be available in older versions. If you prefer a non-formula-based approach, pivot tables can also be used to calculate cumulative averages and other summaries, offering an alternative for users who are less comfortable with complex formulas.
By understanding the capabilities and limitations of each method, you can make informed decisions about the best approach for your data analysis needs.
Media Credit: Chandoo
Disclosure: Some of our articles include affiliate links. If you buy something through one of these links, Geeky Gadgets may earn an affiliate commission. Learn about our Disclosure Policy.