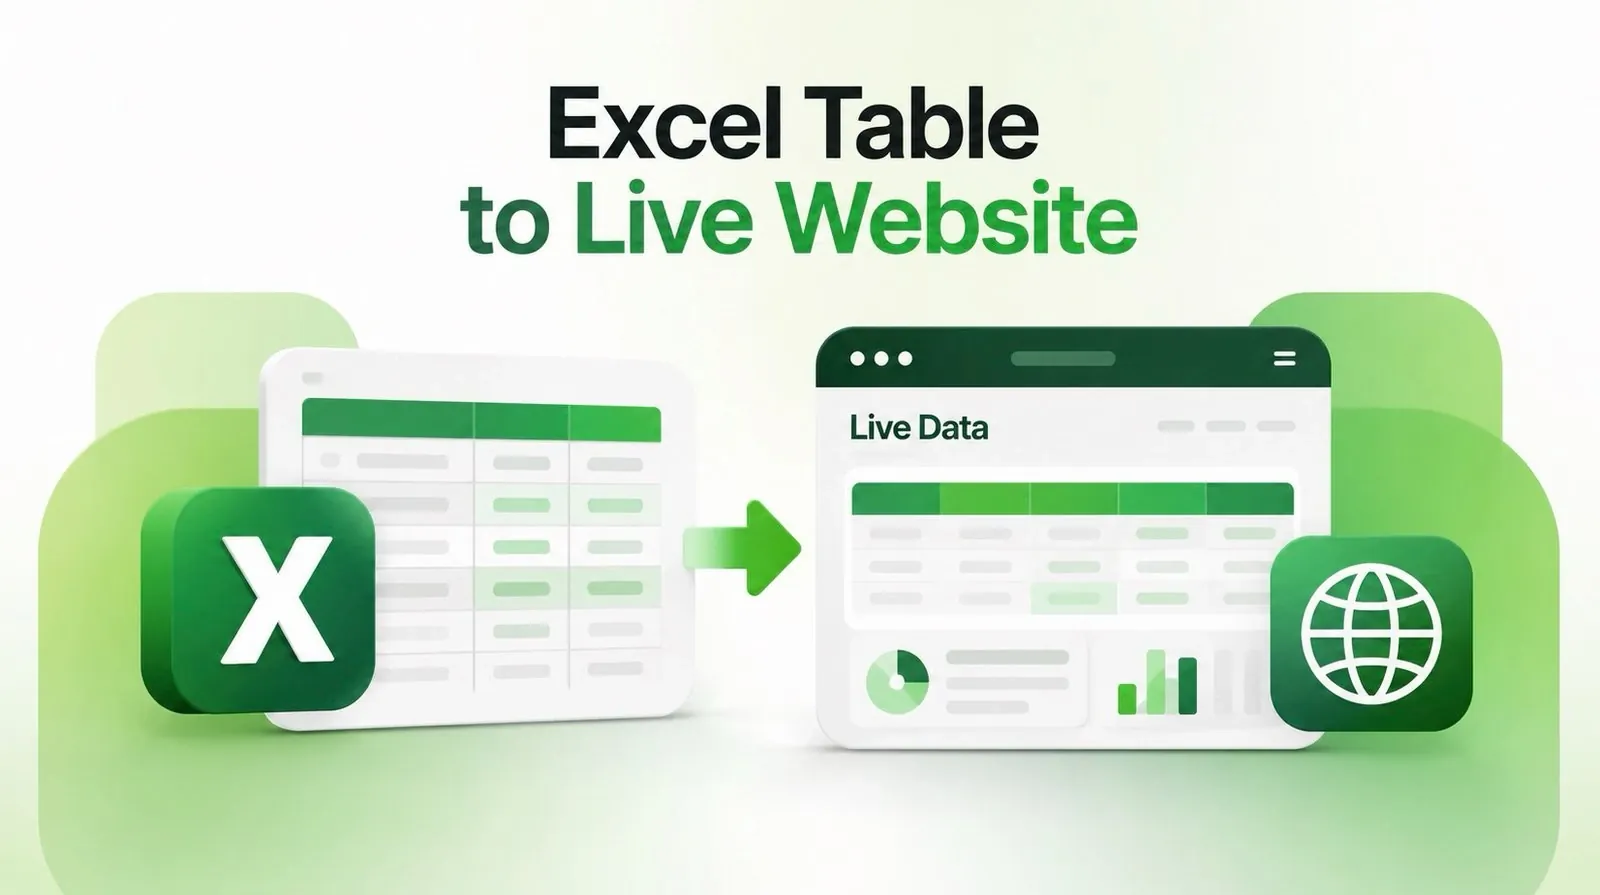
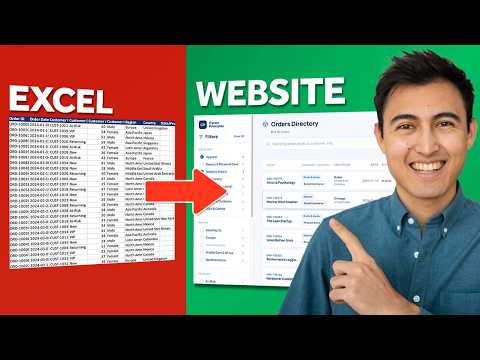
Turning an Excel table into a live website allows you to present data in a more interactive and accessible format. Kenji demonstrates how platforms like Glide or Lovable can be used to create a site that syncs directly with your spreadsheet. One example includes building a searchable directory, where users can filter and sort data to find specific information. This approach is particularly useful for tasks like managing customer records or organizing sales data.
Discover how to design dashboards that present your data visually, set up drill-down features for detailed exploration and enable export options for offline use. Learn how to establish a live connection to keep your site updated automatically and customize its appearance to align with your branding. These steps provide a clear path to creating a functional and user-friendly website.
Turn Excel Into Websites and Dashboards
TL;DR Key Takeaways :
- No-code tools like Lovable, Glide and Software make it easy to transform Excel tables into live, interactive websites with features like searchable directories, dashboards and export options.
- Searchable directories improve navigation by allowing users to filter and sort data, making information more accessible and user-friendly.
- Dashboards and drill-down features enhance data visualization and interactivity, providing users with high-level insights and detailed breakdowns.
- Live data connections ensure the website stays up-to-date by syncing with cloud-stored Excel files, offering real-time updates and transparency.
- Custom branding and thorough testing ensure a professional, cohesive and reliable user experience before publishing the website.
1: Create a Searchable Directory
The foundation of your interactive website is a searchable directory that allows users to quickly locate specific information. This feature improves navigation and ensures that your data is both accessible and user-friendly. For example, if your Excel table contains customer data, users can search by name, location, or purchase history.
- Incorporate search bars and dropdown filters to simplify navigation.
- Allow sorting by key metrics such as date, category, or numerical values.
By allowing users to filter and sort data, you create a seamless experience that encourages interaction and exploration.
2: Build Dashboards for Data Visualization
Dashboards are essential for presenting key performance indicators (KPIs) and summarizing data in a visually engaging way. They provide users with an at-a-glance overview of trends and insights, making complex data easier to understand. To ensure consistency, any filters applied in the searchable directory should also reflect in the dashboard.
- Highlight critical KPIs, such as total revenue, customer growth, or profit margins.
- Use visual elements like bar charts, pie charts and line graphs to make data more digestible.
A well-designed dashboard not only enhances the aesthetic appeal of your website but also improves its functionality by helping users interpret data more effectively.
3: Add Drill-Down Features for Deeper Insights
Drill-down functionality adds depth to your website by allowing users to explore detailed information behind high-level data points. For instance, clicking on a sales chart could reveal individual transactions, customer demographics, or product-specific performance.
- Enable clickable charts and tables to provide detailed breakdowns.
- Link drill-down views to specific rows or categories in your Excel data for seamless navigation.
This feature makes your website more interactive and informative, catering to users who need granular insights.
Become an expert in Excel with the help of our in-depth articles and helpful guides.
- The Hidden Excel Shortcuts Missing from Your Standard Cheat Sheet
- Why Excel Power Users Are Switching to “Zero-Click” Workflows
- The Only Microsoft Excel Tutorial Beginners Need In 2026
- 17 New Excel Features for 2026 to Speed up Your Work
- Master Advanced Excel Functions BYROW vs MAP vs SCAN vs REDUCE
- 4 Excel AI Tools Tested and Microsoft Copilot Finished Last
- Why Excel’s FILTER Function Outperforms VLOOKUP for Complex Data
- Say Goodbye to Complex Excel Formulas with New TRIMRANGE Function
- How to Unlock Excel Sheets Without a Password
- How to use the Excel FILTER function
4: Enable Export Functionality
Export functionality is a practical addition that allows users to download filtered data as a CSV file. This feature is particularly useful for teams or individuals who need to analyze data offline or integrate it into other tools for further processing.
- Ensure the export feature respects any filters applied by the user to provide tailored results.
- Clearly label the export button for easy accessibility.
By allowing data export, you enhance the usability of your website and provide added value to your audience.
5: Set Up a Live Data Connection
A live data connection ensures that your website remains up-to-date by syncing directly with your Excel file. By storing your file in a cloud service like OneDrive or Google Drive, you can enable automatic updates at regular intervals. Adding a “last updated” timestamp builds transparency and trust with users.
- Store your Excel file in a cloud service for seamless integration and real-time updates.
- Configure automatic refresh intervals, such as every 30 seconds, to maintain data accuracy.
This step ensures that your website reflects the most current data, enhancing its reliability and relevance.
6: Customize Branding
Customizing your website with consistent branding improves its professional appearance and strengthens your connection with the audience. Incorporate your company’s logo, select a color scheme that aligns with your brand identity and ensure cohesive fonts and layouts throughout the site.
- Integrate your logo and brand colors into the website design for a unified look.
- Maintain a consistent visual style across all pages to reinforce your brand identity.
A well-branded website not only looks polished but also builds trust and credibility with users.
7: Test and Publish
Before making your website public, it is crucial to thoroughly test all its features to ensure they function as intended. This includes verifying the live data connection, filters, export functionality and drill-down features. Once you are confident that everything is working seamlessly, publish your website and share it with your audience.
- Test live updates to confirm data accuracy and responsiveness.
- Verify that filters, export options and drill-down features operate without errors.
Testing ensures a smooth user experience and minimizes the risk of technical issues after launch.
Transform Your Data Into an Interactive Experience
Converting an Excel table into a live, interactive website allows you to present data in a more engaging and accessible format. By following these steps, creating a searchable directory, building dashboards, adding drill-down features, allowing live data updates and customizing branding, you can design a professional, data-driven platform tailored to your audience’s needs. With no-code tools like Lovable, Glide, or Software, this process is streamlined, empowering anyone to create a functional and visually appealing website.
Media Credit: Kenji Explains
Disclosure: Some of our articles include affiliate links. If you buy something through one of these links, Geeky Gadgets may earn an affiliate commission. Learn about our Disclosure Policy.
