Excel dashboards have reached new levels of functionality with the addition of Copilot’s interactive canvas. This feature allows users to create dynamic reports that include cross-filtering charts, animated visualizations, and dropdown filters. For instance, a travel and expense dashboard was built in just 2 minutes, summarizing metrics like total spend, missing receipts, and spending by category. These updates happen in real-time, as demonstrated by Leila Gharani.
Explore how to use Copilot to create animated customer ranking charts, design Gantt charts for project timelines, and build guided data tours for key insights. Learn how automated updates maintain accuracy across reports and how interactive filters enable detailed analysis. This guide provides practical examples to help you apply these features effectively in your own dashboards.
TL;DR Key Takeaways :
- Copilot’s interactive canvas in Excel enables the creation of dynamic dashboards with features like cross-filtering charts, animated visualizations, and dropdown filters, but limits direct editing and requires Copilot for adjustments.
- A travel and expense dashboard was generated in about 2 minutes using Copilot, featuring KPIs, interactive filters, and dynamic commentary, with insights such as 161 transactions over $500 and 20 transactions over $1,000 in September.
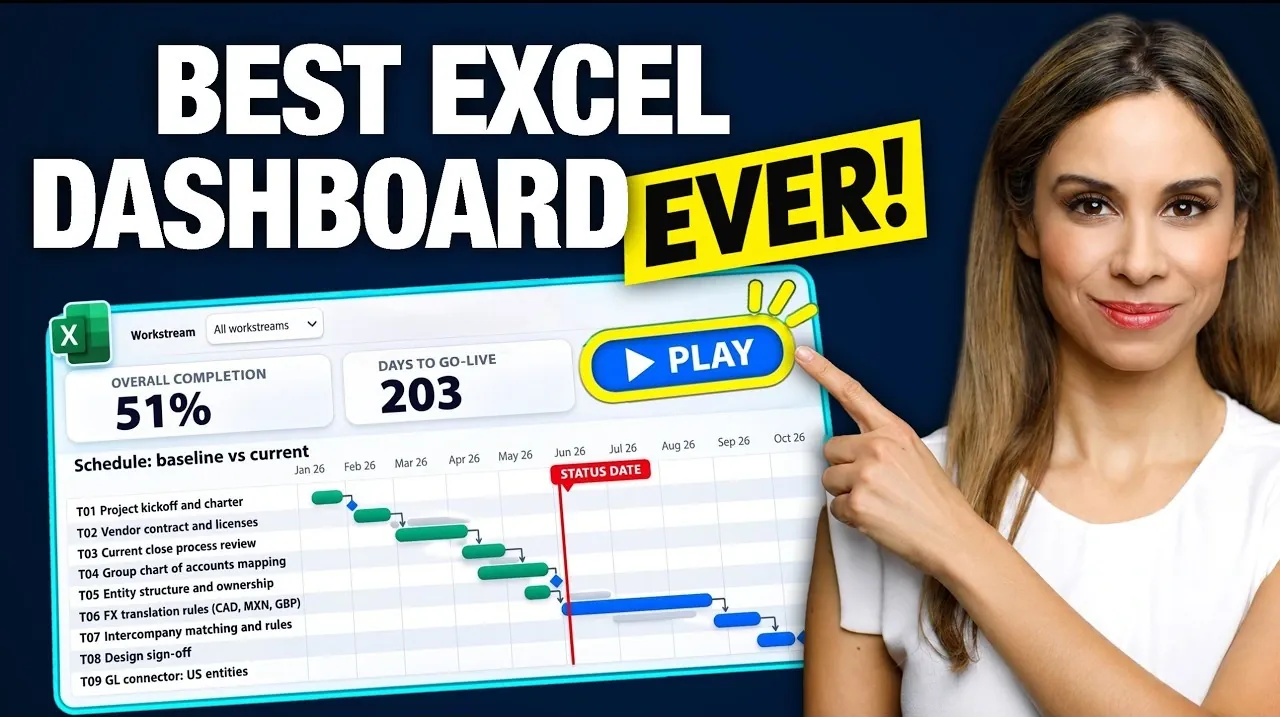
- Copilot can consolidate data into advanced reports, such as a project status report with a scrollable Gantt chart, RAG status, risk matrix, and budget comparisons, dynamically visualizing project delays and progress over time.
- Animated charts, previously unavailable in Excel, are supported by Copilot, allowing users to create engaging visualizations like a top 10 customer ranking chart with a play button to step through monthly data.
- Reports created with Copilot update automatically when underlying data changes, and features like guided tours of findings simplify presentations by applying filters and highlighting key insights dynamically.
Interactive Dashboards in Excel with Copilot
Excel dashboards are evolving with Copilot’s interactive canvas feature. This tool allows users to create dynamic, visually engaging reports with minimal effort, offering capabilities beyond native Excel. Features like cross-filtering charts and animated visualizations are reshaping spreadsheet reporting.
Travel and Expense Dashboard
A travel and expense report created with Copilot highlights its potential. The dataset included approximately 1,000 rows detailing expenses by person, category, location, amount, and receipt status. The prompt used was: “Use the interactive canvas to create a travel and expense report for finance team. Total spent, spent by department, category, and month, missing receipts, and anything that stands out.”
The dashboard, generated in about 2 minutes, included dropdown filters for department, category, month, and receipt status, along with a reset filters option. Key performance indicators (KPIs) summarized total spend, number of transactions, missing receipts, and average expense. Charts displayed spending by department, category, and month, with dynamic commentary.
Interactive features enhanced usability. Users could cross-filter by clicking on chart elements, such as bars or numbers, to drill into details. A slider filtered expenses above a minimum amount, revealing insights like 161 transactions over $500 or 20 transactions over $1,000 in September. Filtering for September showed “hotel” as the largest category, with “desert wister resort” being a significant expense. Commentary and charts updated dynamically based on these filters.
Filtering for April highlighted four missing receipts, all from Adam. Clicking on “operations” showed zero missing receipts, while “sales” revealed four missing receipts and 572 transactions. Hovering over chart elements displayed amounts, and clicking on items like “operations” filtered the report accordingly. Clicking “total spend” displayed “expenses behind total spend,” but only “up to 50” expenses were shown, even when filtering everything to September, which indicated “128 expenses.” Adjusting the slider to 700 displayed “21 expenses.”
The interactive canvas functions like a web page within Excel, residing on its own sheet without visible cells. The ribbon and formula bar are grayed out, and Copilot builds the canvas to read the table directly. While this setup allows advanced interactivity, it limits direct editing. Users cannot right-click to change colors or adjust elements; all modifications must be requested through Copilot. Calculations behind the numbers are hidden but can be accessed by asking Copilot or requesting a separate calculation sheet.
A unique feature is the play button, which adds interactivity uncommon in Excel dashboards. This allows users to explore data dynamically. Copilot can also create a “tour of the findings,” applying filters and highlighting key points for a guided experience.

Expand your understanding of Excel Copilot features with additional resources from our extensive library of articles.
- 6 Powerful Microsoft Copilot in Excel Use Cases & Workflow Examples
- Copilot Excel AI Beginners Guide: Faster Cleaning, Smart Analysis, Python Insights
- New Excel’s Copilot() Function : AI Spreadsheets Just Got Smarter
- Excel Copilot Adds ChatGPT and Claude Switching for Spreadsheets
- MS Excel Copilot Beginners Guide : How to Make Data Analysis Effortless in 2025
- How to use Excel Copilot AI assistant to simplify complex spreadsheet tasks
- How to use Excel CoPilot to improve your daily productivity
- How to use Copilot AI in Excel, Word and Powerpoint
Project Status Report
Copilot can consolidate data from multiple sheets into a single report. For example, a project status report was generated for a steering committee using a workbook with sheets for tasks, team members, risks, and budget. The prompt specified features like a Gantt chart, RAG (red, amber, green) status, a risk matrix, and budget versus actual comparisons.
The resulting report included a scrollable Gantt chart with toggleable dependency lines and options to include or exclude completed tasks. Planned tasks appeared in gray, while actual progress was shown in green. A dropdown allowed filtering by specific workstreams, and the report highlighted delays caused by the “Mexico connector,” which pushed the project’s sign-off date.
Additional features included “status state” (overall status: red), “days to go live: 87,” and a workstream RAG. An open risk matrix displayed the top risks, while a “budget versus actual” comparison provided further insights. Calculations were placed on a separate sheet for transparency.
Dynamic visualization stood out. A play button on the Gantt chart illustrated the project’s progression over time, showing status changes from “green” to “amber” to “red.” This provided a clear narrative of how delays unfolded, offering valuable insights for project management.
Animated Customer Ranking Chart
Copilot supports animated charts, a feature previously unavailable in Excel. Using the prompt, “Add an animated chart that ranks customers by monthly net sales top 10 with a play button that steps through the months and shows the month name,” a dynamic visualization was created.
The chart displayed the top 10 customers by monthly net sales, with a play button enabling users to step through each month. For instance, “Harbor Foods” ranked as the second-highest customer in July before climbing to the top spot later in the year. This animation adds a compelling storytelling element to data presentations.
Automatic Updates and Interactivity
One of Copilot’s standout features is its ability to update reports automatically. Changes to the underlying data are reflected instantly without requiring a manual refresh. For example, altering an expense amount to $50,000 immediately updated the total spend and related figures. Reversing the change restored the original totals seamlessly. The total spent before changes was “251852.”
Copilot can also create guided tours of findings. By clicking a “play findings” button, users can navigate through key insights, with filters applied automatically to highlight important points. This feature simplifies presentations and maintains consistency in reporting.
Limitations and Considerations
Despite its advanced functionality, Copilot has limitations. The interactive canvas restricts direct editing, requiring users to rely on Copilot for adjustments. Visibility into calculations is limited, though users can request a separate sheet for transparency. If the interactive canvas skill is turned off, it can still be used by mentioning it in the prompt. These constraints may challenge users accustomed to full control over their Excel reports.
Copilot’s interactive canvas transforms Excel into a tool for creating advanced dashboards and reports. Its ability to generate visually appealing, highly interactive outputs with minimal effort makes it valuable for professionals in finance, project management, and beyond. However, the reliance on Copilot for edits and the lack of direct access to calculations may require some adjustment. For users seeking dynamic, professional reports, Copilot opens up possibilities that were once unimaginable in Excel.
Media Credit: Leila Gharani
Disclosure: Some of our articles include affiliate links. If you buy something through one of these links, Geeky Gadgets may earn an affiliate commission. Learn about our Disclosure Policy.
