Have you ever felt overwhelmed staring at a massive Excel spreadsheet, unsure how to extract the exact data you need? Whether you’re managing sales figures, tracking inventory, or analyzing project metrics, navigating large datasets can feel like searching for a needle in a haystack. But here’s the good news: Excel’s filtering tools are your secret weapon for cutting through the noise. With just a few clicks, you can isolate the most relevant information, spot trends, and make smarter decisions, all without altering your original data. In this instructional feature, Aldo James demystifies the art of filtering in Excel, showing you how to transform chaos into clarity with confidence and ease. Mastering filters isn’t just a skill, it’s a fantastic option for anyone who works with data.
In the sections ahead, Aldo James uncover practical, step-by-step techniques for creating and using filters, from basic sorting to advanced methods like filtering by color or custom criteria. You’ll also learn how to refine your data with precision, making sure that every analysis you perform is both efficient and insightful. But that’s not all, Aldo James will share expert tips for avoiding common pitfalls, like unintentionally hiding critical information, and teach you how to undo mistakes without breaking a sweat. Whether you’re a beginner or an Excel pro, this guide will help you unlock the full potential of filters and elevate your data analysis skills. After all, the power of Excel lies not just in its formulas but in how you use its tools to tell a story with your data.
Excel Filters Explained
TL;DR Key Takeaways :
- Excel filters are essential for isolating specific data, refining datasets based on criteria, and improving productivity in data analysis.
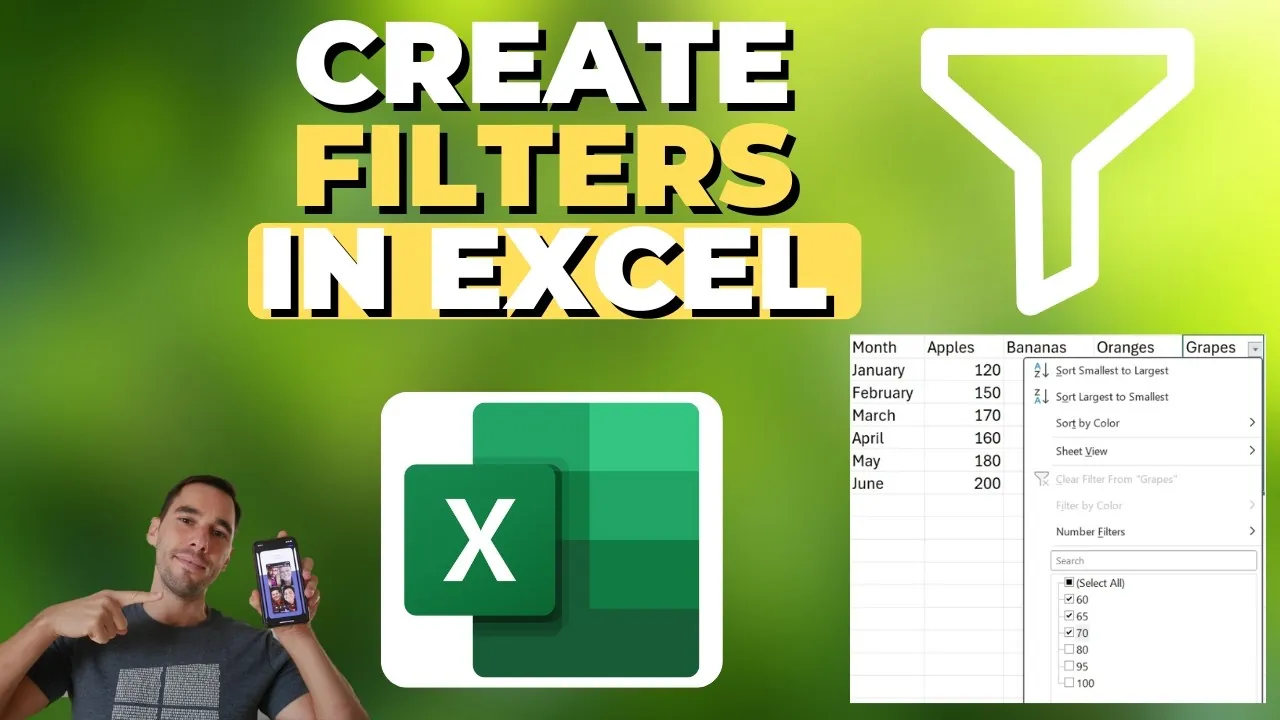
- Filters can be created by highlighting column headers and allowing the “Filter” option, allowing users to sort and filter data through drop-down menus.
- Advanced filtering techniques, such as custom numerical/text filters and filtering by color, enable deeper analysis of complex datasets.
- Filters do not delete data but temporarily hide rows that do not meet the criteria, making sure the original dataset remains intact.
- Excel allows filtering specific sections of a dataset, undoing filter actions with Ctrl + Z, and clearing filters to restore the full dataset view.
How to Create Filters in Excel
Creating filters in Excel is a straightforward process that enables you to organize and analyze data efficiently. To activate filters in your dataset, follow these steps:
- Highlight the headers of your data table to ensure Excel recognizes the columns for filtering.
- Navigate to the “Home” tab, locate the “Sort and Filter” group, and select the “Filter” option.
Once filters are enabled, small drop-down menus will appear in each column header. These menus provide options to sort and filter data based on specific criteria. For example, in a sales report, you can use the drop-down menu in the “Region” column to display data for a particular location. This feature is particularly useful when working with extensive datasets, as it allows you to focus on the most relevant information while temporarily hiding the rest.
Using Filters to Refine Your Data
Filters are a powerful tool for refining data by selecting or excluding specific criteria. Here’s how you can use them effectively:
- Numerical Filters: Apply conditions such as “greater than,” “less than,” or “equals” to focus on specific ranges of numerical data. For instance, filter sales above $10,000 to identify high-performing transactions.
- Text Filters: Use options like “contains,” “begins with,” or “equals” to refine textual data. This is particularly helpful for isolating customer names, product descriptions, or other text-based information.
You can also apply multiple filters across different columns simultaneously. For example, you might filter for sales exceeding $10,000 in one column while narrowing down data to a specific region in another. This layered approach enables you to identify trends, outliers, or patterns with greater precision, making your analysis more targeted and insightful.
Step-by-Step Guide to Mastering Filters in Excel 2025

Here are additional guides from our expansive article library that you may find useful on Excel functions.
- 10 New Excel Functions to improve your formulas
- Excel Formulas and Functions to Skyrocket Your Productivity
- Top 15 Excel Functions to Improve Productivity and Efficiency
- How to Use Modern Excel Functions Like XLOOKUP & TEXTJOIN
- Top Excel Functions You Need to Know According to Harvard
- How to Use Excel Functions for Dynamic Reports and Dashboards
- Top Excel Formulas for Speed & Performance in Large Worksheets
- Mastering Budget vs Actual Analysis with Excel Functions
- Using Excel BYROW & BYCOL Functions for Faster Data Analysis
- How to Use Excel Database Functions for Advanced Data
Clearing Filters Without Losing Data
Once you’ve completed your analysis, it’s important to clear filters to restore the full view of your dataset. Clearing filters is simple and ensures that no data is permanently hidden. To clear a filter:
- Click the drop-down menu in the filtered column and select “Clear Filter.”
- Alternatively, clear all filters at once by selecting “Clear” in the “Sort and Filter” menu on the ribbon.
It’s important to note that filters do not delete data; they only hide rows that do not meet the specified criteria. You can easily identify filtered data by the non-sequential row numbers and the filter icons displayed in the column headers. This feature ensures that your original dataset remains intact and accessible.
Advanced Filtering Techniques for Complex Data
Excel offers advanced filtering options that allow you to handle more complex datasets with ease. These techniques are particularly useful when working with large or intricate data structures. Here are some advanced filtering methods:
- Custom Numerical Filters: Use conditions like “greater than,” “less than,” or “between” to isolate specific ranges. For example, filter sales between $5,000 and $15,000 to analyze mid-range performance trends.
- Custom Text Filters: Refine textual data using options such as “contains,” “does not contain,” “begins with,” or “ends with.” This is ideal for narrowing down customer names, product categories, or other descriptive fields.
- Filter by Color: If your dataset uses color coding, you can filter rows based on cell or font color. This is particularly helpful for visually distinguishing data categories or priorities.
These advanced options allow you to drill down into specific subsets of your data, allowing deeper analysis and more informed decision-making.
Filtering Specific Sections of Your Dataset
In some cases, you may want to filter only a specific section of your dataset without affecting the rest. Excel allows you to do this by highlighting the relevant rows before allowing the filter option. This method is particularly useful for analyzing subsets of your data, such as quarterly sales figures or department-specific metrics.
For example, to focus on sales data from a particular quarter, highlight the rows corresponding to that quarter and apply filters. This targeted approach ensures that your analysis remains precise and relevant, avoiding unnecessary adjustments to unrelated data.
Undoing Filter Actions
Mistakes are a natural part of working with data, but Excel provides an easy way to correct them. If you apply a filter incorrectly or make an unwanted change, simply press Ctrl + Z to undo your last action. This feature allows you to experiment with different filtering criteria without the risk of losing your original data view. By using the undo function, you can confidently explore various filtering options to find the most meaningful insights.
Maximizing the Benefits of Excel Filters
Filters in Excel are a versatile and indispensable tool for managing and analyzing data efficiently. By allowing filters, applying specific criteria, and using advanced options, you can uncover valuable insights and streamline your workflow. Always remember to clear filters when they are no longer needed and use the undo function to correct errors. Whether you are working with simple lists or complex datasets, mastering Excel filters will empower you to make more informed decisions and optimize your data management processes.
Media Credit: Aldo James
Disclosure: Some of our articles include affiliate links. If you buy something through one of these links, Geeky Gadgets may earn an affiliate commission. Learn about our Disclosure Policy.